In this section, let us explore the dataset and generate a profiling report with various statistics using the ydata-profiling library (https://docs.profiling.ydata.ai/4.5/).
The ydata-profiling library is a Python library for easy EDA, profiling, and report generation.
Let us see how to use ydata-profiling for fast and efficient EDA:
- Install the ydata-profiling library using pip as follows:
pip install ydata-profiling - First, let us import the Pandas profiling library as follows:
from ydata_profiling import ProfileReport
Then, we can use Pandas profiling to generate reports.
- Now, we will read the Income dataset into the Pandas DataFrame:
df=pd.read_csv(‘adult.csv’,na_values=-999) - Let us run the upgrade command to make sure we have the latest profiling library:
%pip install ydata-profiling –upgrade - Now let us run the following commands to generate the profiling report:
report = ProfileReport(df)
report
We can also generate the report using the profile_report() function on the Pandas DataFrame.
After running the preceding cell, all the data loaded in df will be analyzed and the report will be generated. The time taken to generate the report depends on the size of the dataset.
The output of the preceding cell is a report with sections. Let us understand the report that is generated.
The generated profiling report contains the following sections:
- Overview
- Variables
- Interactions
- Correlations
- Missing values
- Sample
- Duplicate rows
Under the Overview section in the report, there are three tabs:
- Overview
- Alerts
- Reproduction
As shown in the following figure, the Overview tab shows statistical information about the dataset – that is, the number of columns (number of variables) in the dataset; the number of rows (number of observations), duplicate rows, and missing cells; the percentage of duplicate rows and missing cells; and the number of Numeric and Categorical variables:
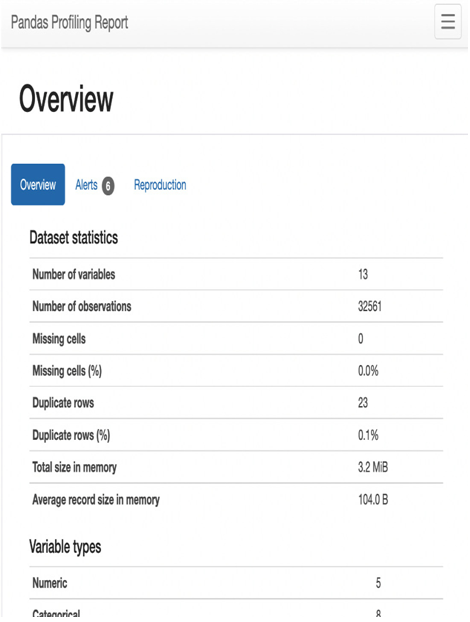
Figure 1.25 – Statistics of the dataset
The Alerts tab under Overview shows all the variables that are highly correlated with each other and the number of cells that have zero values, as follows:
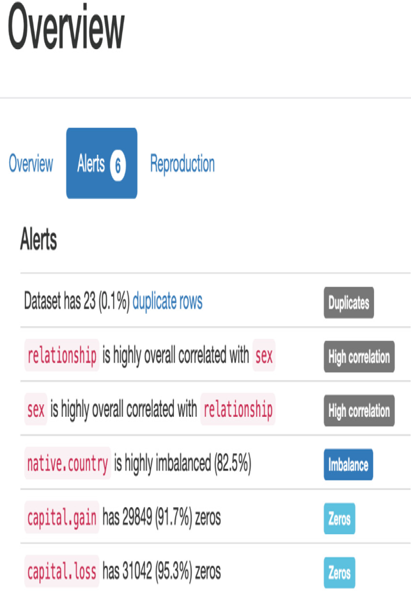
Figure 1.26 – Alerts
The Reproduction tab under Overview shows the duration it took for the analysis to generate this report, as follows:
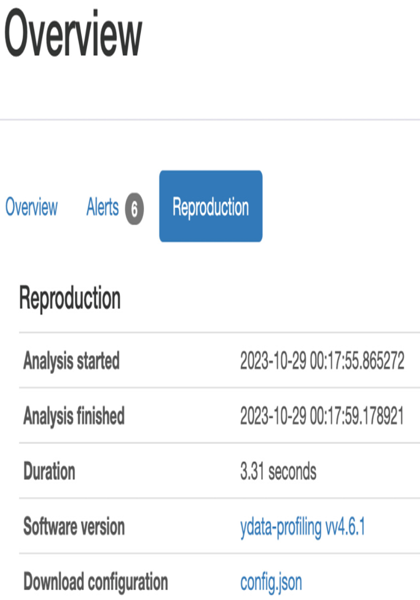
Figure 1.27 – Reproduction